
Survey Use Cases

 / Twitter")
Most asset managers use surveys as a tool in some capacity, but typically in a point-in-time, ad hoc, basis. The results of custom surveys are undoubtedly valuable, but there is a lot more edge to be generated if you have history behind the data, as tracking data inflection is extremely valuable.
When it comes to investing, survey data is arguably most valuable when everyone is on board with one investment idea, but you see an inflection point in time series data that indicates the opposite, or at least something different. Here are some of the best ways to use longitudinal survey data...
Pressure Testing a Thesis
Investors spend a lot of money on third party data to inform their models, but less on third party data used to pressure test their original thesis for why a company is overvalued or undervalued.
In other words, investors have a catalyst in mind they feel is underappreciated by the market. Whenever this thesis / catalyst is related to a consumer behavior or sentiment, it can be pressure tested by surveying consumers.
Example:
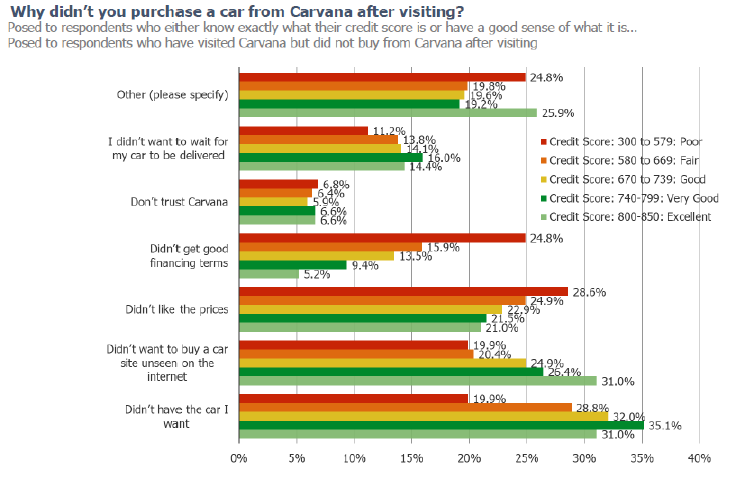
We used feedback from an audience of consumers who looked into buying from Carvana but decided not to, combined with cross-tab analysis based on their credit score, to pressure test the thesis that a cohort of consumers have been priced out because of financing terms / the down payment.
Channel Checks, at Scale
Most analysts rely on a handful of expert network calls to take a supply chain’s temperature (demand, order trends, budget priorities, inventory building / thinning, lead times stretching out or pulling in, pricing dynamics, etc.). A survey can be deployed on a larger sample set of industry participants to generate more quantitatively significant learnings.
Example:
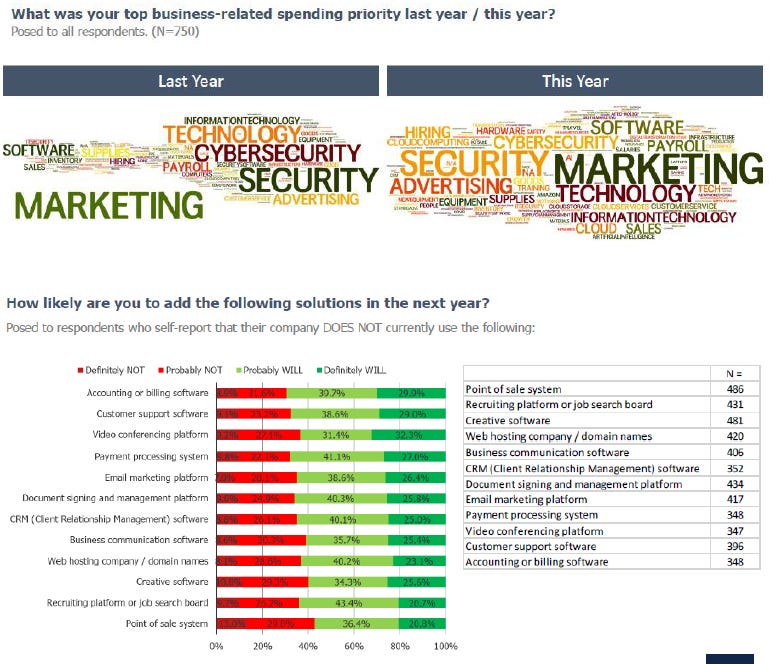
We surveyed IT decision makers (N+750) to understand a variety of issues. Doing this sort of diligence at scale opens up research avenues that don’t exist via a handful of calls.
Share Winners and Losers
Survey data is extremely useful in helping to identify winners and losers within a peer group as the winning and losing is being done. Combining and cutting quantitative and qualitative data will show you plainly who is winning/losing share to whom, and why.
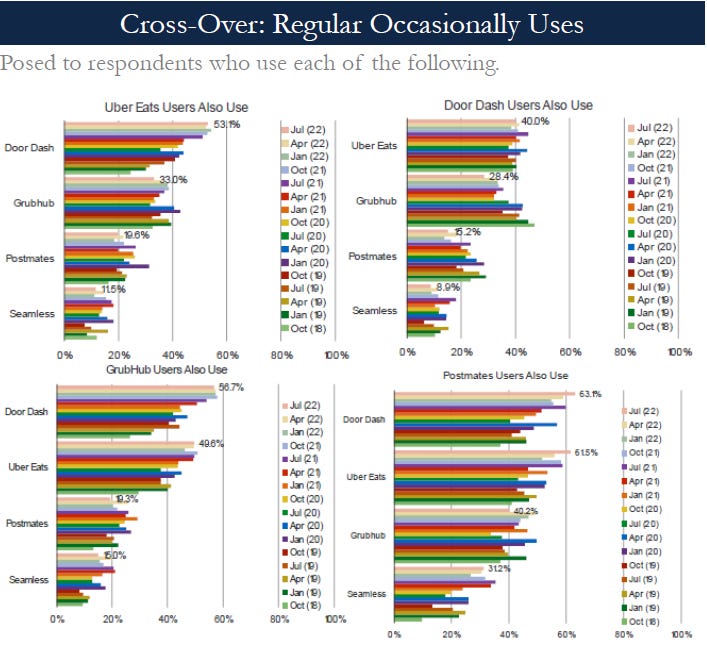
Example: We found that DoorDash has made significant gains in consumer awareness and usage in the US. Our cross-over analysis shows that most users of other platforms are adopting DoorDash, but users of DoorDash are either reducing usage of others (Postmates, Grubhub) or holding steady (Uber Eats). This suggest share gains that shouldn’t merely be chalked up to a rising tide lifting all boats.
Getting to Know the Customer
It can be valuable to run cohort analysis of a user base, track how it is changing over time, and compare that data to peers.
Example:
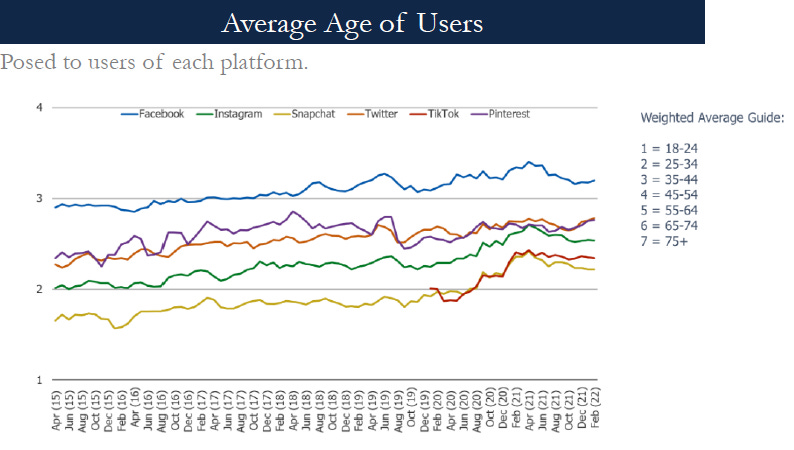
We filter users of any brand/service to show age, income, ethnicity, etc. (either in aggregate or broken down). If conducted longitudinally, we can show how the cohorts have evolved/changed over time.
Cohort Drivers
When it comes to adoption curves of disruptive technologies / forces, we’ve found that there are certain cohorts who are typically earlier adopters. These people typically drive change as they age, and their opinions can be weighted to gain a nuanced understanding of the tectonic forces at play under the surface of the names you’re covering.
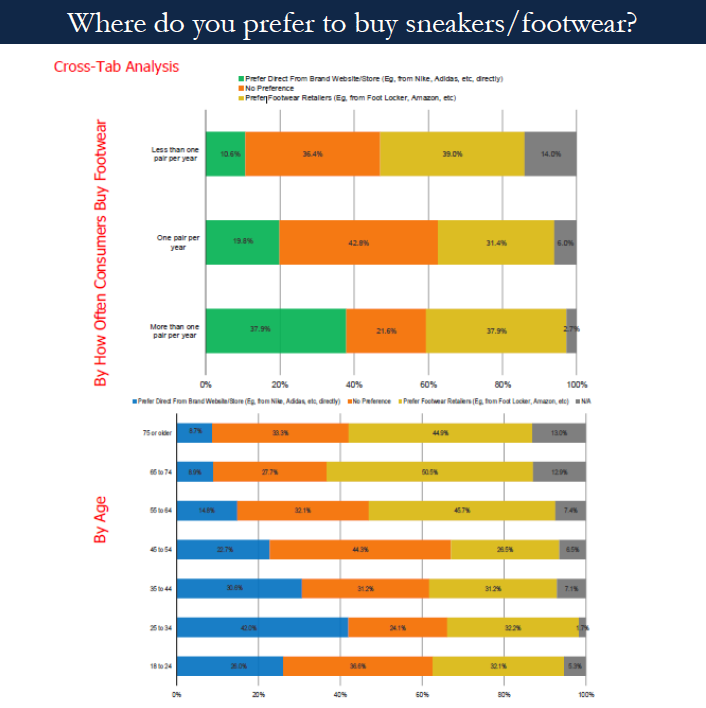
Example: In the footwear end market, two KPIs we keep track of are a) consumer proclivity to buy footwear direct from the brand rather than a retailer, and b) proclivity to buy footwear online. Cohort analysis shows that younger respondents and respondents who buy more pairs of sneakers per year are considerably more likely to buy direct / online. Impact weighing cohorts would suggest that these trends will have some staying power
Idea Generation- Inflections
Inflection points in long tracked survey data can generate ideas, oftentimes when you discover a disconnect between market sentiment and what is going on under the surface
Example: In the following charts we observe an inflection point in a COVID trend’s unraveling- grocery deliveries pulling back from COVID highs.

Pricing Power- ARPU
There are a variety of types of pricing analyses that you can run in a survey to understand the following…
Current satisfaction with price/value among customers
Pricing perceptions around price/value among non-consumers
Room to raise prices
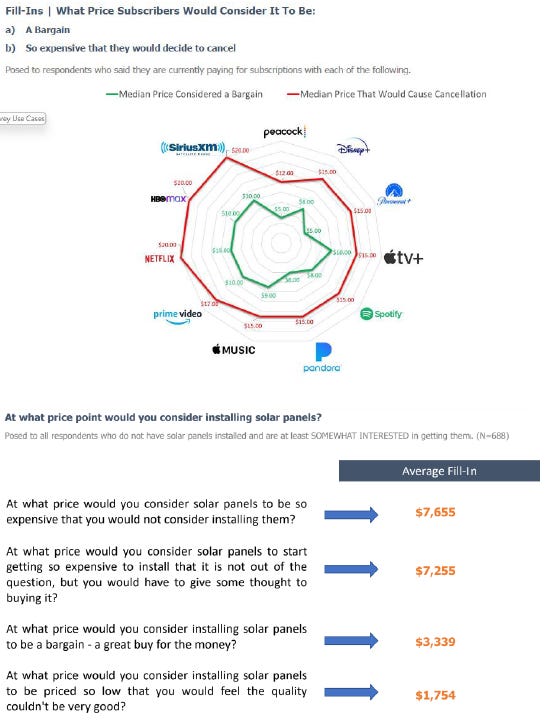
These data points can hep generate more accurate model assumptions related to ARPU. You can also test consumer expectations around pricing for an unreleased product or service to understand if the company properly priced the product they plan on taking to market.
Example:
Netflix pricing power, Netflix account sharing and possible account sharing surcharge, solar panel pricing perceptions.

Understanding “the why”
One of the top complains we hear from data folks is that they can identify a trend, but before PMs will act on the datapoint they want to know “why” it is happening. The quantitative nature and qualitative capabilities of the survey instrument bridges the gap so hard data insights can find their way into investment processes with added confidence.
Example:
By segmenting the audience into groups who chose to buy cars from Carvana and those who did not purchase a car from Carvana, we were able to obtain useful color related to “the why”.
